A decade ago, Recurring Monthly Revenue (RMR) tracking
looked like this:
| Dealer accounts: |
1,000 |
| Avg. rate/account: |
x $25 |
| Dealer RMR: |
$25,000 |
Sadly, this wonderfully simple approach rarely works these days,
due to the rapid adoption of interactive services (Alarm.com, Total
Connect, etc.) and the increasing stratification of subscriber service
levels. Yes, most dealers still do have a base of plain vanilla digital,
or cell-based, accounts at standard base rates. With the wide range
of new services now available, bundled or a la carte, the metrics of
tracking and reporting RMR are evolving quickly. Dealers need to
embrace both consistent account management processes and software
powerful enough to give them the key information they need.
“When dealers talk to me about their RMR, the first thing I ask is
for them to break it down for me. That’s often when things bog down.
Good RMR reporting is one of the biggest challenges we face,” said Jim
Wooster Jr., president of Alarm Financial Services, Corte Madera, CA.
Because RMR is the basis for dealer valuations both in purchase
and financing transactions, an upgrade of our approach to RMR may
be in order. It has become far more complicated, so we need to rethink
our process for defining RMR, tracking RMR growth, tracking
attrition, accounting for rate increases/decreases, etc. As Cornerstone
has worked with dealers, and especially with the funding companies
that finance them, we’ve evolved our software and reporting to try to
keep up with this brave new world. This white paper shares some of
our conclusions.
DEFINING RMR
The first step is defining RMR—below is a list of typical recurring codes:
| Code |
Description on Invoice |
| MAI |
Maintenance Agreement |
| MED CSS |
Medical Monitoring Services |
| MON |
Monitoring Service |
| MUSC CEL |
Cellular Monitoring |
| OCR |
Open & Close |
| OCRSUP++V |
Supervised Open Close |
| PMT PLAN |
Payment Plan |
| POTSLINE |
Monthly Monitoring Phone Line |
| TC2 |
Total Connect Stand Alone |
| TC2 S TC2 |
Adv with Automation |
While all of these are recurring charges, buyers and funding companies
will not likely include them all in valuations. By definition,
payment plan charges will roll off at the end of the agreed-upon payment
term, so would usually be excluded. Dealers using payment
plans would want to exclude these amounts when calculating attrition,
to avoid overstating that percentage. Some funding companies
would exclude maintenance agreements from their funding formula.
The bottom line for defining RMR is that, as with many things
in life, it depends. So from a software perspective, it’s important to
provide a code-by-code opt-in such as this:
Flagging ‘Monitoring’ as ‘Core Recurring’ while excluding ‘Payment
Plan’ allows precise tracking and reporting, and the flags can be
quickly adjusted based on who’s getting the reports.
In most cases, buyers/lenders will also disqualify seriously pastdue
accounts. For that reason, it is easiest if at least one software report
provides an RMR tally with a ‘Collateral Calculation—RMR for
accounts with aging less than 90 days’ filter built in.
| Collateral Calculation — RMR for accounts with aging less than 90 days = $23, 355.74 |
COUNTS OR DOLLARS?
Once RMR is clearly identified, the next issue is whether to track
dollars, counts or both. The old model was “average RMR” times the
number of accounts, to arrive at a valuation or a funding base. In our
view, the best RMR metric is Total RMR Dollars, after adjusting for
non-core/non-qualified recurring charges.
Below is the first line of our software’s RMR Tracking Report:
| Recurring Changes Summary |
Amount |
Charge Count |
Account Count |
| Beginning RMR
(includes Section 5 Continuing RMR) |
76,418.38 |
1,819 |
1,012 |
A buyer/lender cares most about the green number above, but we
also provide both the number of accounts (site locations) and the
number of charges. Those numbers definitely tell a story. If the number
of recurring charges are about the same as the number of accounts,
that suggests that either the dealer likely has a more traditional
base of accounts—few add-on services—or that the dealer
bundles charges into a single amount. In the above example, the average
account has roughly 1.8 charges and pays an average rate of over
$75. Those metrics would normally be quite attractive to buyers/
lenders, because of the high rate and the relatively high ratio of charges
to accounts.
So dollars are most important, but counts are also very useful to
help establish averages, as noted in the paragraph above. Good account
management software should provide both quick summaries
and trends over time, as well as underlying counts and the ability to
export raw data details to spreadsheets in order to allow for slicing
and dicing data as desired.
TRACKING RMR GROWTH
Growth in RMR is more complicated these days, and can be the
result of:
- New accounts (brand new, or re-signed)
- New services added for existing accounts
- Rate increases to existing accountsIn addition, it’s worth reviewing a couple of other items:
- Future RMR not yet invoiced
- Pending RMR not yet online
RMR for new accounts is straightforward, though some new accounts
are actually re-signed accounts due to a move. Dealers with an
aggressive move/re-sign program can sometimes demonstrate that a
chunk of their attrition is actually not lost accounts, but re-signed
accounts. Flagging these accounts in the software should allow for
a separate line item for re-signs. Likewise, it’s valuable to break out
both the dollars and the counts for new services added by existing
accounts, as well as for rate increases.
If a dealer puts an account online, but has not yet billed the recurring,
is that RMR? Similarly, if a prospect accepts a proposal from the
dealer, but the install has not yet occurred, is that RMR?
It is potential RMR, but it’s not active RMR, so our reports exclude
these categories from current RMR. Nevertheless, it’s valuable to report
these numbers “below the line” as FYI items.
This at least provides the dealer a view of RMR in the pipeline and
can provide meaningful information especially for owners and managers—
a preview of the backlog, accounts that will be added soon.
TRACKING RMR ATTRITION
RMR attrition is more complicated as well, and can be the result of:
- Cancelled accounts
- Cancelled services for existing/continuing accounts
- Rate decreases for existing accounts
These three are just the flip side of the growth discussion above.
However, managing attrition can (and often does) mean the difference
between success or failure. You can’t manage what you don’t
measure, so entering reasons for every cancellation into the account
management software is critical:
| Cancel Reason List |
| Business Closed |
| Can’t Afford |
| Don’t Use Syst |
| False Alarms |
| Moved |
| Non-payment |
| Service Problem |
| Went to Compet |
Assigning a cancellation reason should allow for easy—and extremely
valuable—reporting:
Some of the cancellation reasons are controllable, some are not.
The most common reason for cancellation involves a move of some
type. In the above chart, ‘Moved’ and ‘New Location’ for a business
adds up to over 36 percent. Properly managing move-in/move-out
scenarios can have a huge impact on ‘net growth’. A high percentage
of re-signs due to customer moves is the hallmark of a company that
both tracks its move-driven cancels, and has a pro-active program to
manage these subscribers. Yes, it’s complicated, but it’s also lucrative;
good move programs can often generate brand new customers, from
the move-in side of the equation.
PUTTING IT ALL TOGETHER
Now that we’ve determined definitions, growth elements, and attrition
elements, it’s time to look at the big picture. RMR changes can be
reviewed for one year, two years, or perhaps six months to see more
recent trends.
| |
Average |
Annualized |
| RMR New Growth Rate / Rate Increases % |
2.1 |
25.7 |
| RMR Attraction Rate / Rate Decreases % |
-1.2 |
-14.9 |
| RMR Net Growth % |
0.9 |
10.8 |
This summary shows growth rates in green, attrition (negative
growth) in red, and RMR net growth in blue. In this example, top line
RMR growth is excellent at 25 percent plus annualized, but attrition
is also quite high at about 15 percent, resulting in net growth of more
than 10 percent.
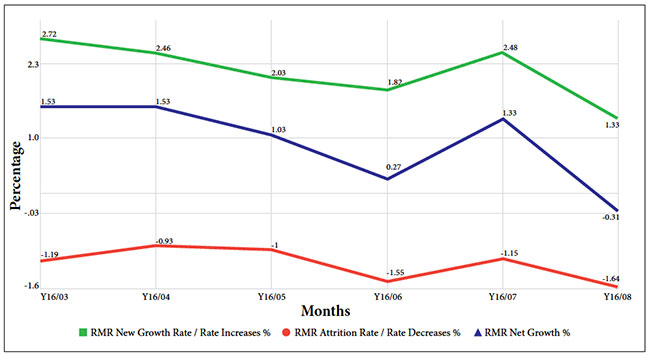
Just as valuable is a visual of trends for these three numbers, over
time like the line chart on the next page.
Line charts like these give managers a quick read on where things
are going. In the example, the blue line (net growth) seems trending
downward—mainly because growth (green line) has slowed. So it may
be time to review the growth program(s), and take corrective action.
From there, good software should allow for drilling down into
each month to see the metrics—growth elements and attrition elements,
by dollars, charge counts, and customer counts:
Y16/08
|
|
|
|
| Recurring Changes Summary |
Amount |
Charge Count |
Account Count |
| Beginning RMR (includes
Section 5 Continuing RMR) |
79,558.04 |
2,185 |
1,915 |
| Section 1: New RMR /
New Accounts |
843.88 |
18 |
17 |
| Section 1: New RMR /
New Accounts (Re-Signed) |
39.99 |
1 |
1 |
| Section 1: New RMR /
Existing Accounts |
151.49 |
5 |
5 |
|
Section 2: Stopped RMR /
Closed Accounts |
-1,230.70 |
35 |
35 |
| Section 2: Stopped RMR /
Open Accounts |
-67.99 |
2 |
2 |
| Section 4: Incremental RMR
Increases |
26.01 |
3 |
3 |
| Section 4: Incremental RMR
Decreases |
-3.00 |
1 |
1 |
| Ending RMR |
79,317.72 |
2,172 |
1,897 |
The above snapshot is for August 2016. The summary numbers
smooth out the ups and downs by taking averages of multiple months,
but a company should be able to scrutinize details for a period where
performance was relatively strong or weak. A good software reporting
system should allow dealers to go further, providing individual
account and charge details behind these summary numbers. That
level of detailed analysis will allow owners, managers and staff to review
the ‘nitty gritty’ stories behind the raw data and then try to optimize
things that worked, correct things that didn’t, or both.
ADVANCED METRICS
In the coming years, security dealers, along with industry buyers and
lenders, will likely start grouping its accounts based on service levels,
such as:
Each of these groups will have its own metrics—average rate,
charges (services) per account, and so on. For example, perhaps the
Basic subscribers pay an average of $22 per month. Some analysis
shows that many of these subscribers pay relatively low rates of $15 to
$18 per month, perhaps because they were signed on many years ago.
Implementing a selective rate increase for these low rate accounts,
which is fair given current market rates, can bump up the $22 average
to perhaps $23 to $24 and immediately improve margins. Given easy
access to the detailed growth and attrition data described earlier, it’s
much easier to take targeted action to improve the bottom line.
From a marketing standpoint, grouping accounts also allows dealers
to focus on upgrading Basic accounts to Standard, and Standard
accounts to Premium. Programs like this are especially important
now, as cable and media companies aggressively advertise to try to
poach accounts from traditional dealers. Assigning each account to a
group allows a dealer’s management team to set goals for upgrades as
well as for new accounts. It’s much less expensive to cross-sell existing
customers than it is to find and sign on new customers.
Finally, while RMR is the most convenient metric for buyers and
lenders, even more important is the margin each RMR segment generates.
“Once we get a breakdown of the RMR, we need to have the
dealer show us how much they make on each segment,” says AFS’s
Wooster. “The top line RMR is a great starting point, but what matters
most to us is profit by type of recurring.” Again, good software
should allow for assignment of costs—such as wholesale monitoring
fees, billing costs, and other variable costs—to each recurring charge.
ACCURACY BREEDS CONFIDENCE
Whether it involves funding, buying and selling accounts, or simply
ramping up growth, one of this industry’s biggest issues is determining
accurate growth and attrition rates. Many, many deals have blown
up because of this. With the dynamism in this industry right now, it’s
more important than ever to invest in account management systems
that allow dealers to easily track—and build—their RMR.
If growth financing is needed, being able to immediately generate
the reports and metrics a lender needs will breed the confidence that
lender needs to extend credit. If a dealer is thinking of selling accounts,
the same holds true – solid RMR reporting gives buyers confidence
that the dealer ‘has its act together’, and may therefore boost
the multiple a buyer is willing to offer. “Buyers and lenders don’t like
uncertainty,” Wooster from AFS concludes. “Uncertainty reduces valuation
multiples, and on the flip side, accurate reporting can improve
the valuation a buyer or lender assigns to a dealer’s accounts.”
The vast majority of dealers are neither selling nor seeking a
loan, but they are certainly looking to both retain their customers
and drive faster growth. Investing the time and money to implement
an industry-specific software platform will provide a very quick payback,
by offering a real-time look at how the business is performing,
and why. Only then can confident decisions be made to set goals, and
to follow through with targeted and measurable programs to achieve
those goals.